Portfolio Valuation
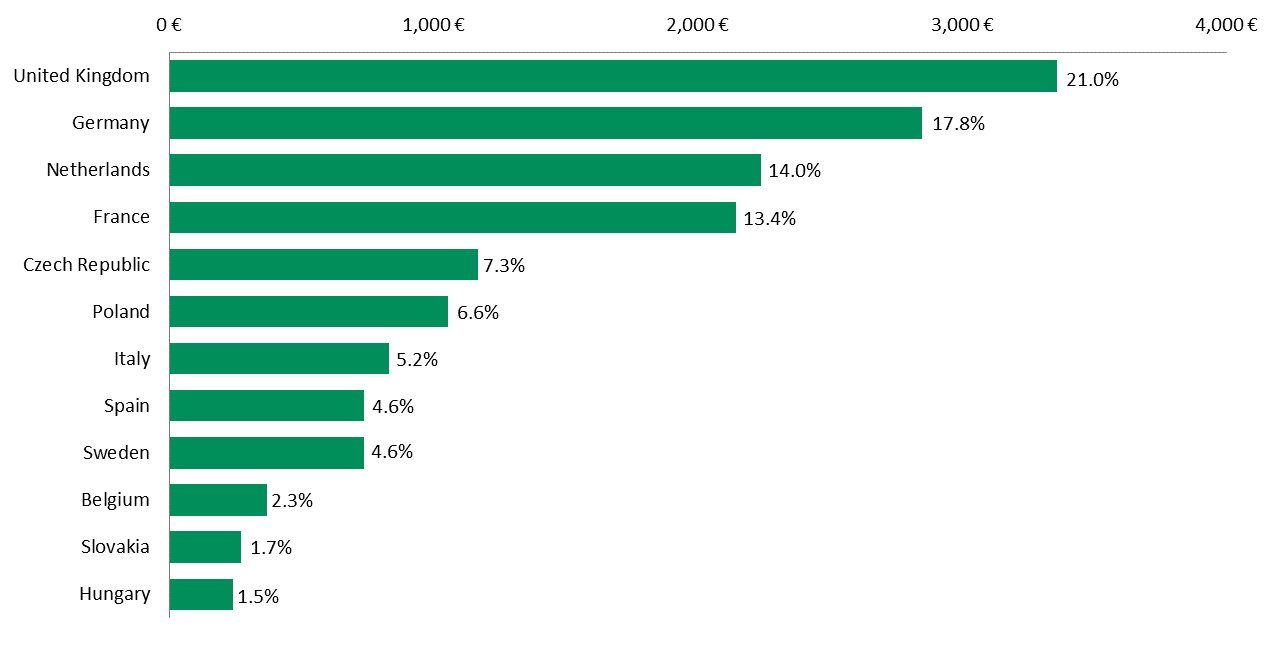
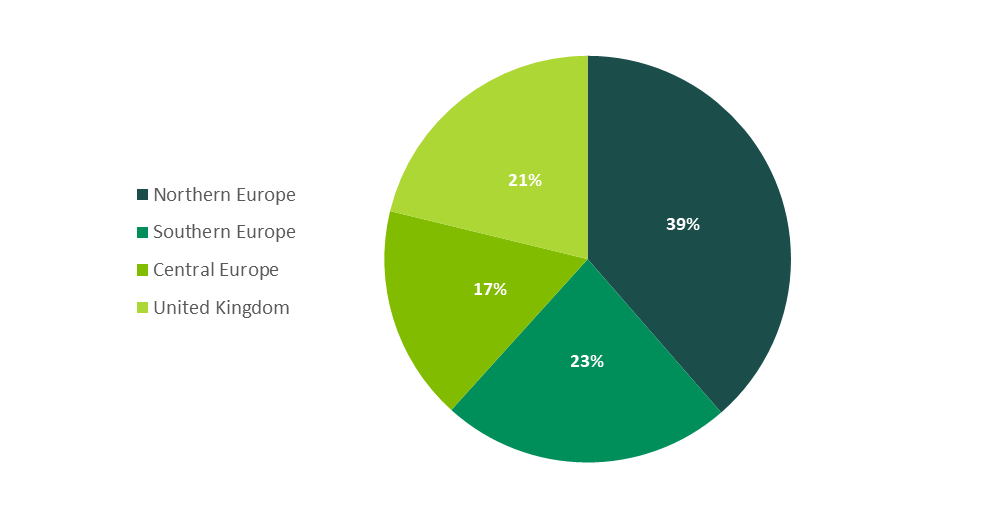
The Fund’s portfolio is geographically diversified across 50 markets in 12 European countries. The following charts show the total portfolio’s geographical distribution based on the market value of 797 properties owned by the Fund as at 31 December 2023, in terms of allocations by country and region.
Net Property Value by Country (€ million) | Geographic Distribution by Net Value (€ million) |
 |
 |
Fourth Quarter PORTFOLIO Occupancy Results
Total portfolio occupancy is 97.8%. Total leasing activity covered over 737,000 SQM.
PORTFOLIO Occupancy by Region

Expiries/Next Lease Breaks – Annualised Ending Base Rent (AEBR) (€ MILLION)

The Fund has a diversified customer base, which consists of 1,233 leases.
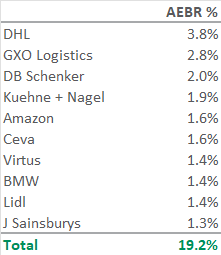
- No one customer comprises more than 3.8% of the total annualised ending base rent.
- In total, the top 10 customers account for only 19.2% of the total annualised ending base rent of the Fund.
The following table lists the top 10 customers and their share of the total annualised ending base rent of the Fund.

